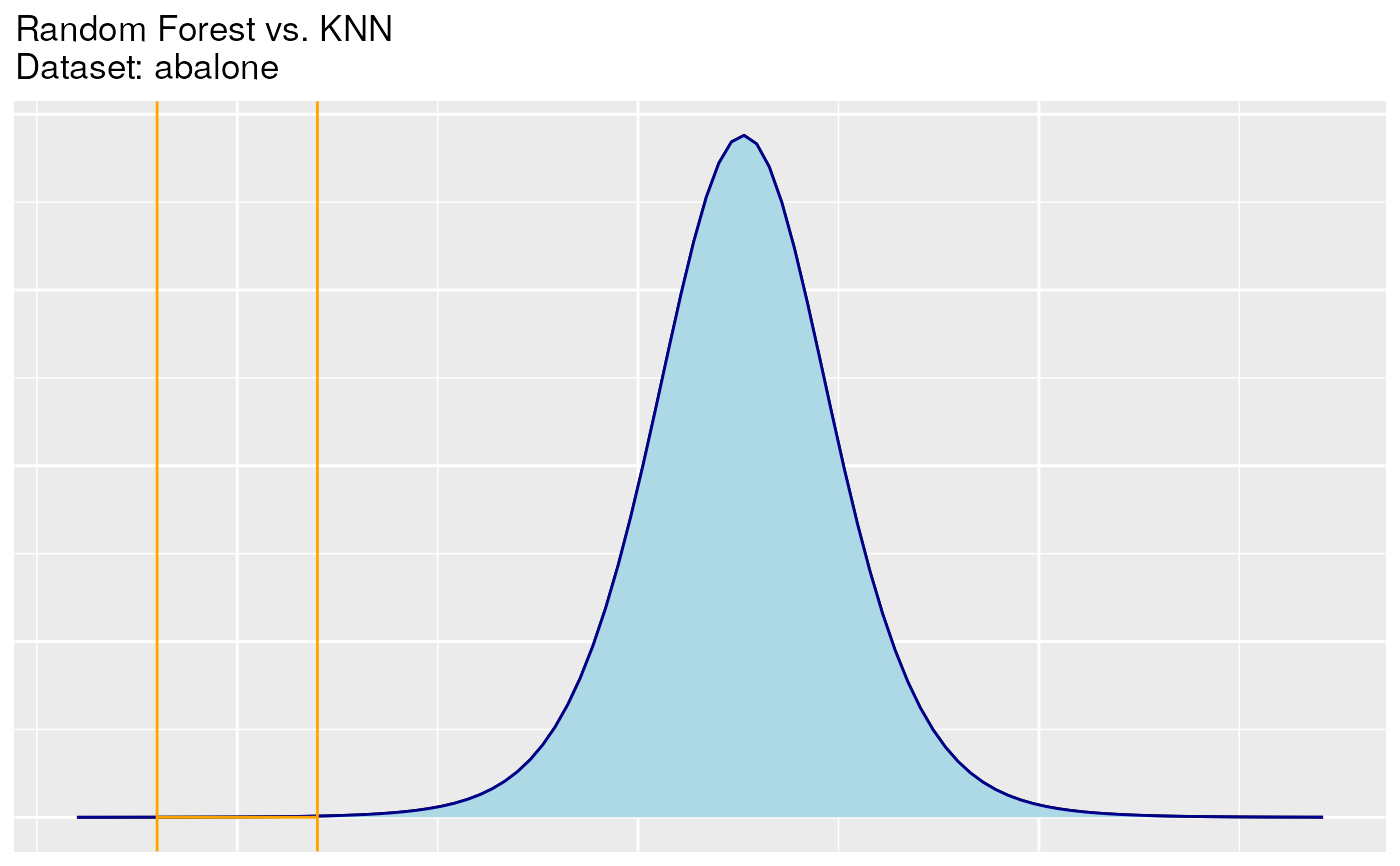
Plot of posterior t distribution
plot.PosteriorT.RdThis function plots the posterior distribution of the parameter
# S3 method for PosteriorT
plot(x, ...)
Arguments
| x | Data of the posterior distribution |
|---|---|
| ... | Extra parameters for plot |
Examples
cbt <- bayesianCorrelatedT.test(results.rf[1, ], results.knn[1, ])
plot(cbt) + ggplot2::ggtitle("Random Forest vs. KNN \nDataset: abalone")