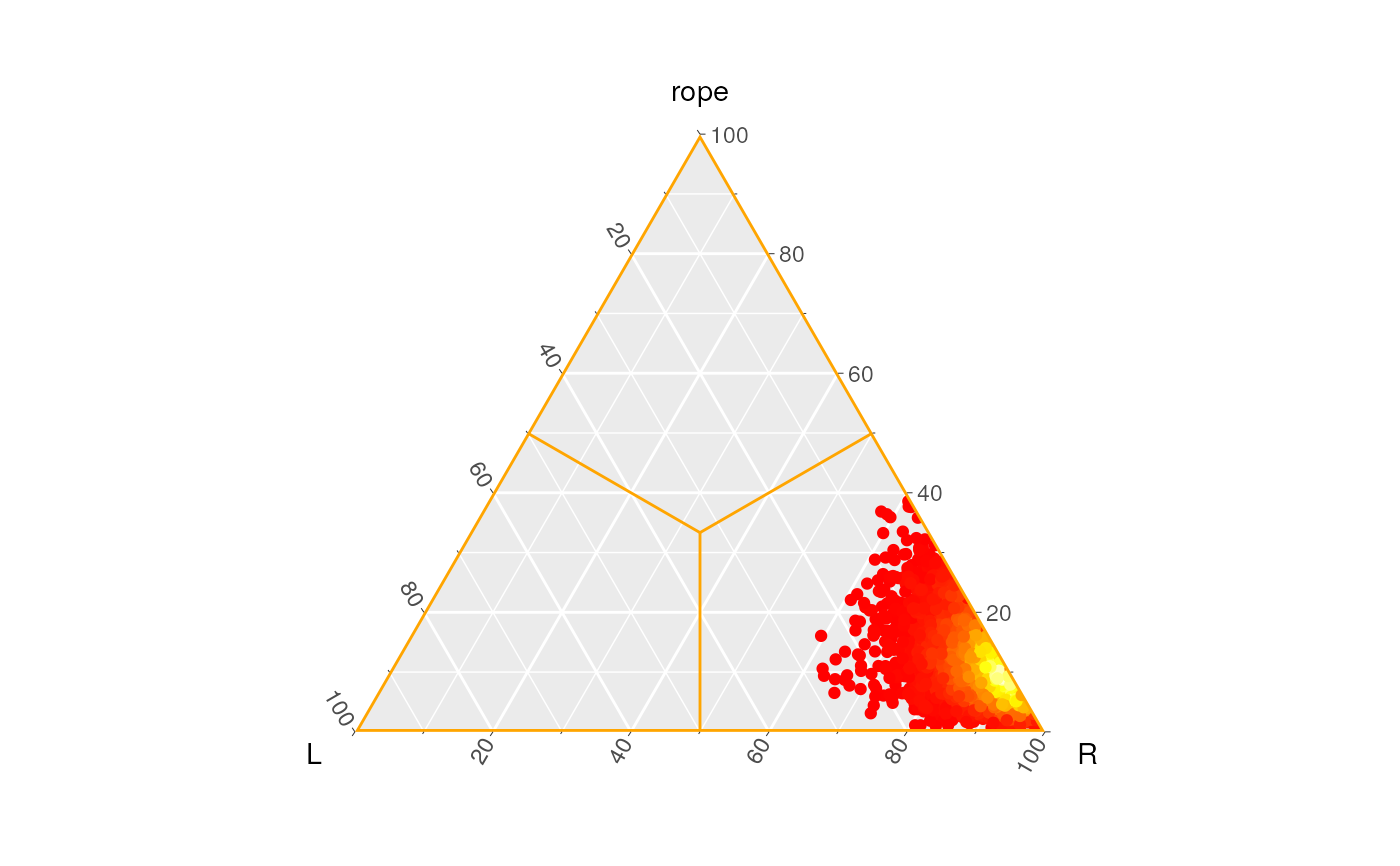
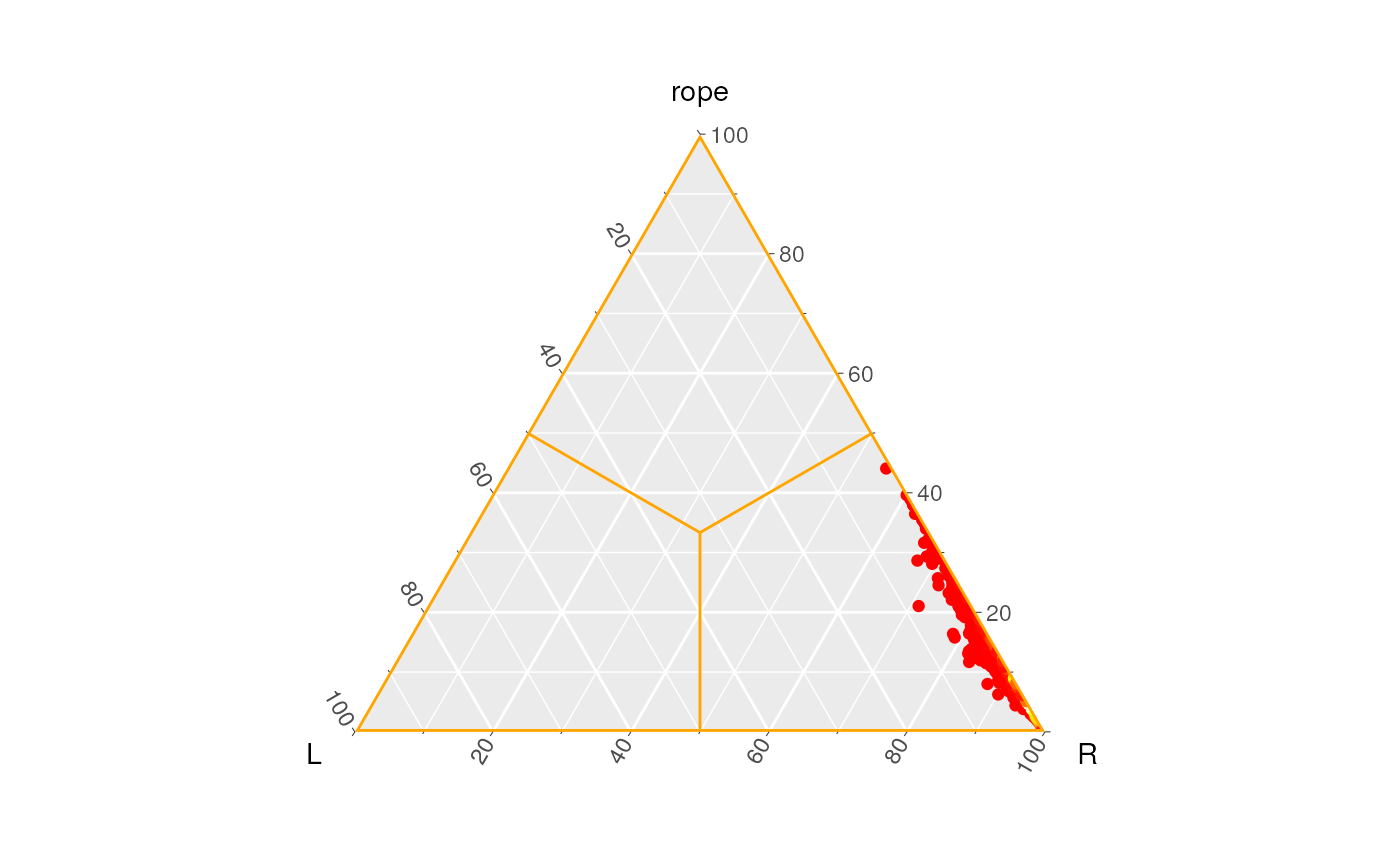
Plot posterior Dirichlet distribution
plot.PosteriorDirichlet.RdPlot of the projection of 3-simplex points of a posterior Dirichlet distribution into a 2D triangle
# S3 method for PosteriorDirichlet
plot(x, num.points = nrow(x$sample), ...)
Arguments
| x | Simplex points to be projected |
|---|---|
| num.points | Number of points to be shown |
| ... | Extra parameters for plot |
Examples
#> #> #> #> #>

